Are these rotating roof vents driven by wind, stack effect, or exhaust fans?
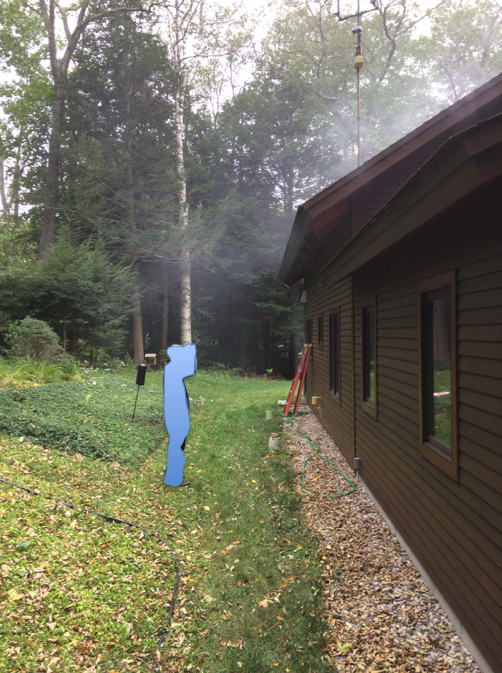
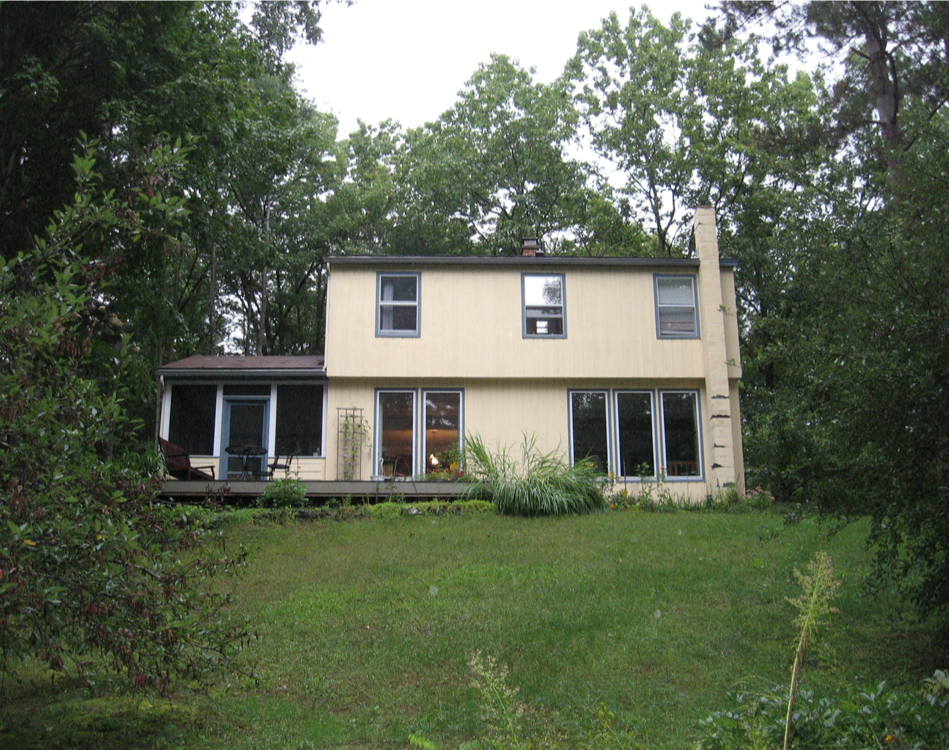
Back in October, I wrote a blog post called “Can Buildings Take Vacation Too?” about the potential need to be concerned with moisture issues when a building is shut down for an extended period of time. I had just completed a building investigation of a home that was left unoccupied for about four months each winter.
At the end of that post, I mentioned that I had been given permission from the homeowners to monitor the home when they shut it down from December 2019 through April 2020. I had four HOBO data loggers recording temperature and relative humidity: one outdoors, one in the basement, one on the first floor, and the last on the second floor.
Here’s a look at the charts that show temperature (blue) and relative humidity (orange) in the basement, on both floors, and outside. Note that both floors of this home have a lot of south-facing glass and during shutdown all the shades are left up to allow the sun into the home, with doors between all rooms wide open.


Some generalizations from the data
Not surprisingly:
- The basement data show the least variation in temperature and relative humidity.
- The outdoor data show the most variation in temperature and relative humidity.
- All spaces show big changes in temperature and relative humidity, much of the time as expected—when temperature goes down, RH goes up and vice versa, but there are times when both temperature and RH rise together, and vice versa.
- All four loggers show drastic changes on December 19/20—the day the house was shut down—and March 16/17—the day the couple returned and turned everything back on.
The table below shows the high/low for each space monitored during the shutdown:
| Space | Temp – high (°F) | Temp – low (°F) | RH – high (%) | RH – low (%) |
| Outdoors | 79.4* | -5.8 | 100 | 23.5 |
| Basement | 43.2 | 32.5 | 68 | 46.5 |
| 1st floor | 51.8 | 20.6 | 63.8 | 30.6 |
| 2nd floor | 56.7 | 19.7 | 58.8 | 27.2 |
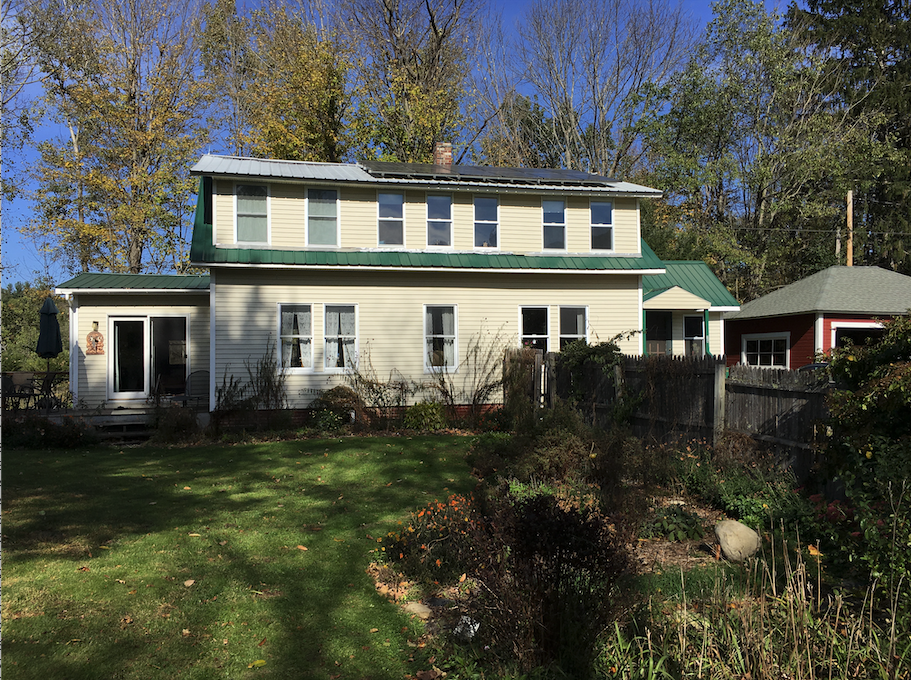
*The outdoor datalogger was tucked up into a small, open-frame, gable roof over an entryway (clad with dark green metal); on the day this logger read 79.4° F, the closest weather station recorded a high temperature of 66°F.
No space (except the outdoors) reached a relative humidity of 70%.
The table below shows averages for each space.
| Space | Average temp (°F) | Average RH (%) |
| Outdoors | 33.7 | 60.2 |
| Basement | 45.5 | 52.9 |
| 1st floor | 46.1 | 37.9 |
| 2nd floor | 46.8 | 32.2 |
Is precipitation driving swings?
There are a lot of big swings in both relative humidity and temperature in the three interior spaces in this shutdown home. Take a look, for example at the image below for the morning of January 12.

Here’s the data for the morning of January 12 (7 am) from all four loggers, adding in the absolute moisture content in grains of water per pound of dry air.
| Space | Temperature (F) | RH (%) | Absolute Humidity* (g/lb dry air) |
| basement | 41.7 | 57.8 | 23.7 |
| 1st floor | 44.6 | 63.8 | 29.3 |
| 2nd floor | 49.0 | 58.8 | 31.9 |
| Outdoors | 56 | 98.4 | 69.7 |
*using an altitude of 1500 feet above sea level.
Remember from Part I of this project, I identified three drivers of moisture content in the home: bulk water (including capillarity/wicking), air leakage, and diffusion.
I looked first for a connection between interior moisture and precipitation, with the assumption that if connected, precipitation is getting into the basement (perhaps primarily up through the basement slab and/or splash-back onto the above-grade portion of the foundation (which is mostly several courses of brick).
I used daily weather data from weather underground; the closest reporting station with daily data is North Clarendon, about 40 miles from Saxton’s River. I simply could not find a consistent relationship between precipitation and interior moisture. And for January 12, the absolute moisture content of the air in the basement is less than the floors above.
What about air leakage?
Incidents like the morning of January 12 are interesting because both temperature and interior relative humidity increased a lot and quickly. And on the same day, the image below shows air temperature, precipitation, and wind.

Sure looks as though after precipitation (in this case, rain)—while the outdoor moisture content is quite high (at least in relationship to interior moisture content)—it’s wind that drives moisture into the home by way of air leakage. Checking similar conditions throughout the home shutdown period supports this.
Similarly, air leakage driven by wind can rapidly dry out interior spaces; see the table and weather data screenshot below for January 17. When it is dry and windy outside, air leakage is drying out the interior spaces (with the above-ground floors responding more quickly than the basement).
| Space | Temperature (°F) | RH (%) | Absolute Humidity* (g/lb dry air) |
| basement | 38.7 | 51.8 | 18.9 |
| 1st floor | 36.4 | 31.0 | 10.3 |
| 2nd floor | 34.1 | 33.9 | 10.3 |
| Outdoors | 15.0 | 38.4 | 4.2 |

NOTE: While I did not conduct a blower door test on this home, I do know that no air sealing has been done and the home seems quite leaky.
Conclusions
I don’t want to draw too many conclusions based on the data from just one building, but it sure seems as though unless buildings are getting wet from bulk water, interior spaces with no other source of moisture respond to outdoor air moisture content, with the response deepened and quickened in air-leaky buildings.
So, yes, in general, homes can go on vacation too, at least hygrothermally…